Complete example
As exposed in the introduction, an analytics request consists of filters, dimensions and metrics.
Before writing the request, it is important to carefully think about what each of these operators should be. Ask yourself these questions:
- Which subset of documents of the project do I want to analyze? These are my filters. Examples:
- all the project's mentions (empty filterset)
- only English mentions (
languagefilter) - only positive mentions (
sentimentfilter) - only mentions containing a specific word or sentence (
queryfilter)...
- How do I want to split them into buckets? These are my dimensions. Examples:
- split by date in daily, weekly or monthly buckets (
datedimension) - split by country (
countrydimension)...
- split by date in daily, weekly or monthly buckets (
- What numerical values do I want to compute for each bucket? These are my metrics. Examples:
- just count the mentions in each bucket (
volumemetric) - compute the average interaction count (
interactions_avgmetric)...
- just count the mentions in each bucket (
Example: building a sentiment-over-time graph#
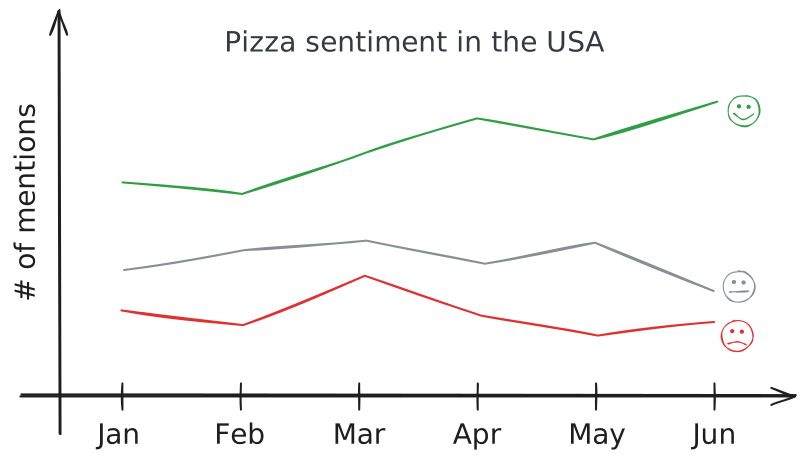
Say we want to build a line chart representing the evolution of sentiment, month over month for the first half of 2026, for US-located mentions of a "Pizza" topic.
Here's a sketch of the graph we want to build:
What are the filters, dimensions and metrics?
- filters:
- published in the first half of 2026 (
datefilter) - located in the USA (
countryfilter) - matching the project's "Pizza" topic (
topic/subtopicfilter)
- published in the first half of 2026 (
- dimensions:
- first split mentions by month buckets (
datedimension) - then split each month by sentiment (
sentimentdimension)
- first split mentions by month buckets (
- metrics:
- count of mentions in each bucket (
volumemetric)
- count of mentions in each bucket (
Usually, in a line chart, the X-axis corresponds to the main dimension, and the Y-axis to the metric. The second dimension can be used to split the data into multiple series (lines) over the same X-axis.
The corresponding request to the API is:
POST /projects/123456/mentions/_analyze HTTP/1.1
Content-Type: application/json

{
    "filters": {
        "date": {
            "values": {
                "gte": "2026-01-01T00:00:00Z",
                "lt": "2026-07-01T00:00:00Z"
            }
        },
        "country": {
            "values": [
                "USA"
            ]
        },
        "subtopic": {
            "values": [
                "bnp97h0a95b99en9vdr0"
            ]
        }
    },
    "dimensions": [
        {
            "type": "date",
            "interval": "month"
        },
        {
            "type": "sentiment"
        }
    ],
    "metrics": [
        {
            "type": "volume"
        }
    ]
}
This is the response:
{
    "result": {
        "values": {
            "volume": 105323
        },
        "buckets": [
            {
                "id": "2026-01-01T00:00:00Z",
                "type": "date",
                "values": {
                    "volume": 19531
                },
                "buckets": [
                    {
                        "id": "positive",
                        "type": "sentiment",
                        "values": {
                            "volume": 8278
                        }
                    },
                    {
                        "id": "neutral",
                        "type": "sentiment",
                        "values": {
                            "volume": 4875
                        }
                    },
                    {
                        "id": "unassigned",
                        "type": "sentiment",
                        "values": {
                            "volume": 4355
                        }
                    },
                    {
                        "id": "negative",
                        "type": "sentiment",
                        "values": {
                            "volume": 2023
                        }
                    }
                ]
            },
            {
                "id": "2026-02-01T00:00:00Z",
                "type": "date",
                "values": {
                    "volume": 17955
                },
                "buckets": [
                    {
                        "id": "positive",
                        "type": "sentiment",
                        "values": {
                            "volume": 7772
                        }
                    }
                    // other sentiment buckets...
                ]
            }
            // other month buckets...
        ]
    }
}
The response contains "buckets" (the results of dimensions) and "values" (the results of metrics). From this data, you can easily construct the line chart with your plotting library of choice.
See also#
- Filtering for how to build a
filtersobject, and the Filters reference for every supported key. - Using dimensions for how to build the
dimensionslist, and the Dimensions reference for every supportedtype. - Using metrics for how to build the
metricslist, and the Metrics reference for every supportedtype.