Introduction to Analytics
Analytics allow computing numerical values representing certain aspects of the mentions within a project.
They are the source of data for all the quantitative charts that can be built in your project's dashboards.
An analytics request always involves three distinct primitives, running sequentially in that order:
- filters
- dimensions
- metrics
Analytics: a visual introduction#
Assume that instead of analyzing mentions, we are analyzing some geometrical objects. Each one has the following properties:
- shape: circle, square or triangle
- color: yellow, red, blue or green
- size: represented by a number: 1, 2 or 3
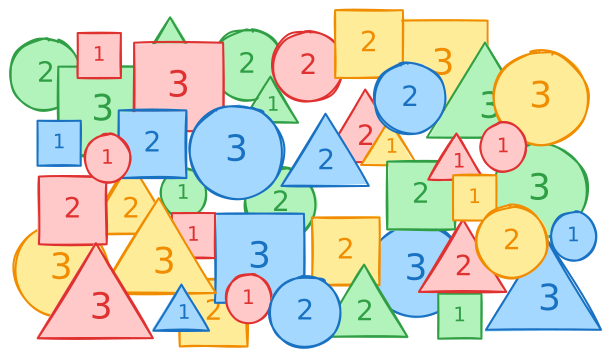
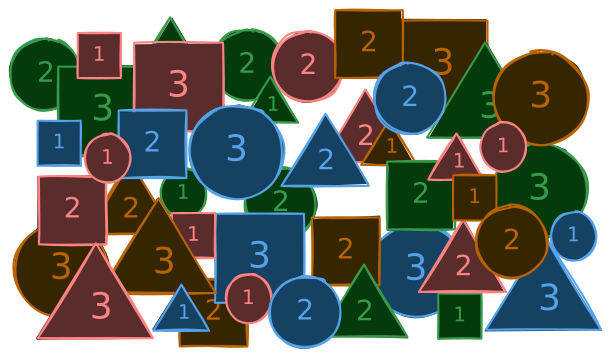
Filters
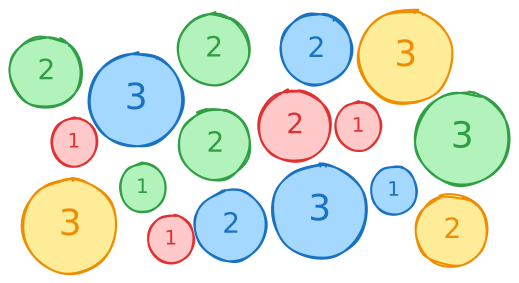
Filters select documents that match them, and discards the rest.
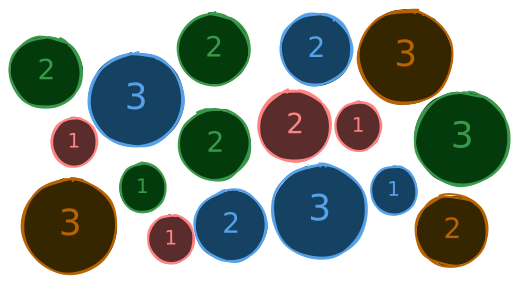
For example, here is the output of a shape = circle filter:
Dimensions
Dimensions take the filtered set of documents and distributes them into buckets.
For example, here is the output of a color dimension:
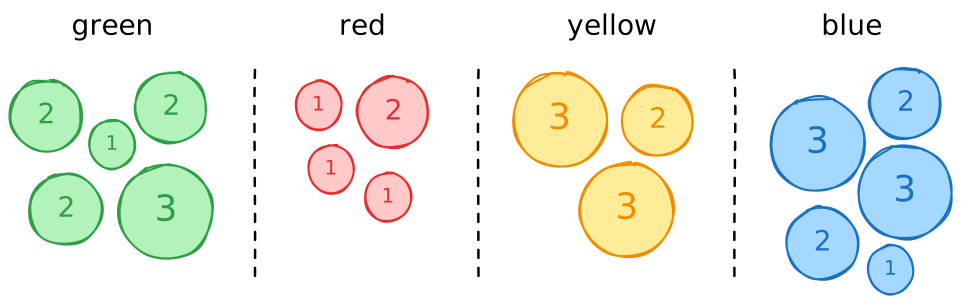
If there are more than one dimension, each bucket is further subdivided into sub-buckets.
To send them in a request, see Using dimensions.
The Dimensions reference lists every supported type.
Metrics
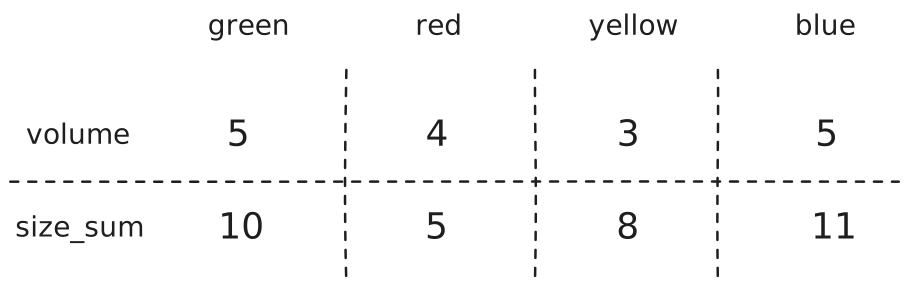
Metrics take the buckets and assigns a numerical value to each one.
For example, asking for the volume (count) and the hypothetical size_sum metrics would give:
To send them in a request, see Using metrics.
The Metrics reference lists every supported type.